 MarkHub
Analytics
Understand your SKU profitability
Follow the numbers from your dashboard to an individual product. See what sold, what it cost, and what remains as profit.
- 01
Start with your dashboard
Open Dashboard for an overview of your results. Compare the summary tiles before exploring the products behind those totals.
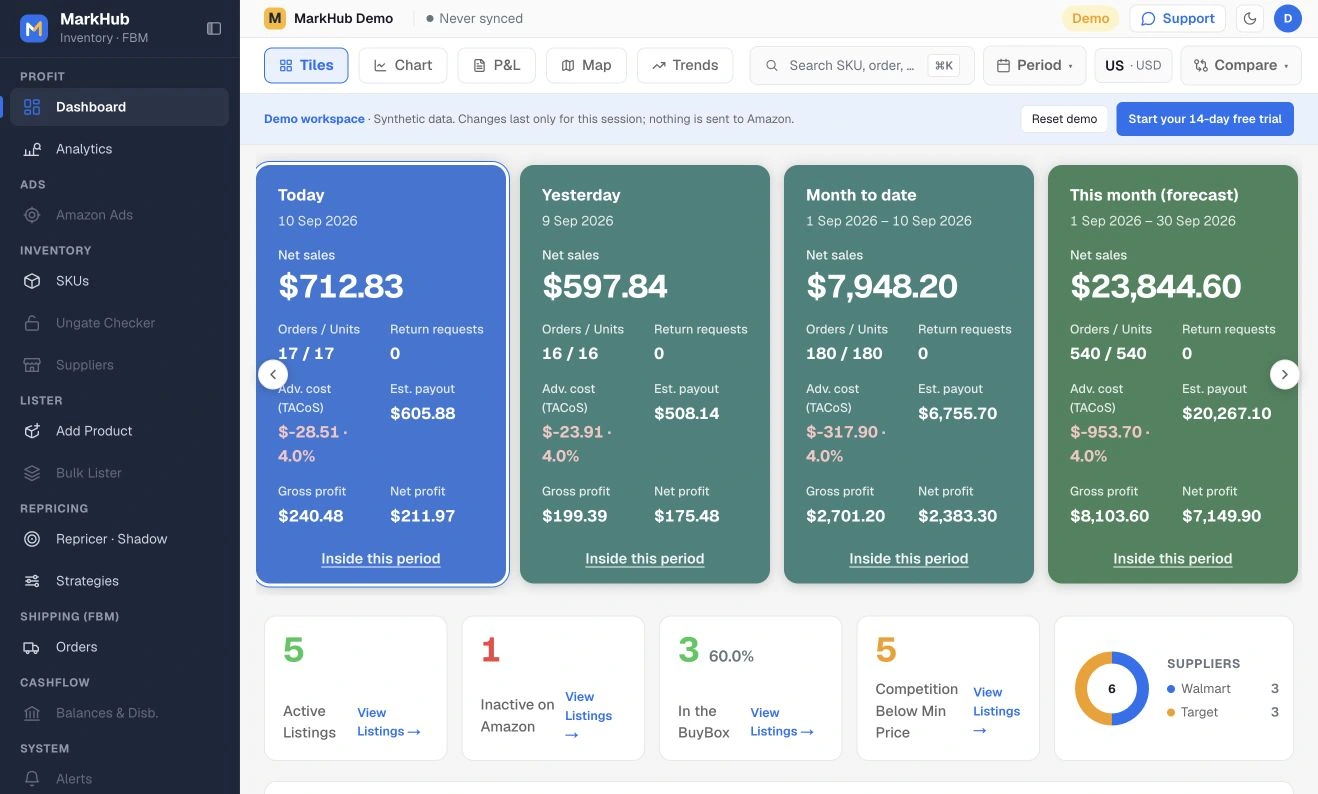
Dashboard overview. The cards summarize the selected reporting periods. - 02
Open SKU Profitability
Open Analytics and select SKU Profitability. Choose a reporting period, such as Past 30 days. Review Highest Profit, Highest Revenue and Highest Units Sold for that same period.
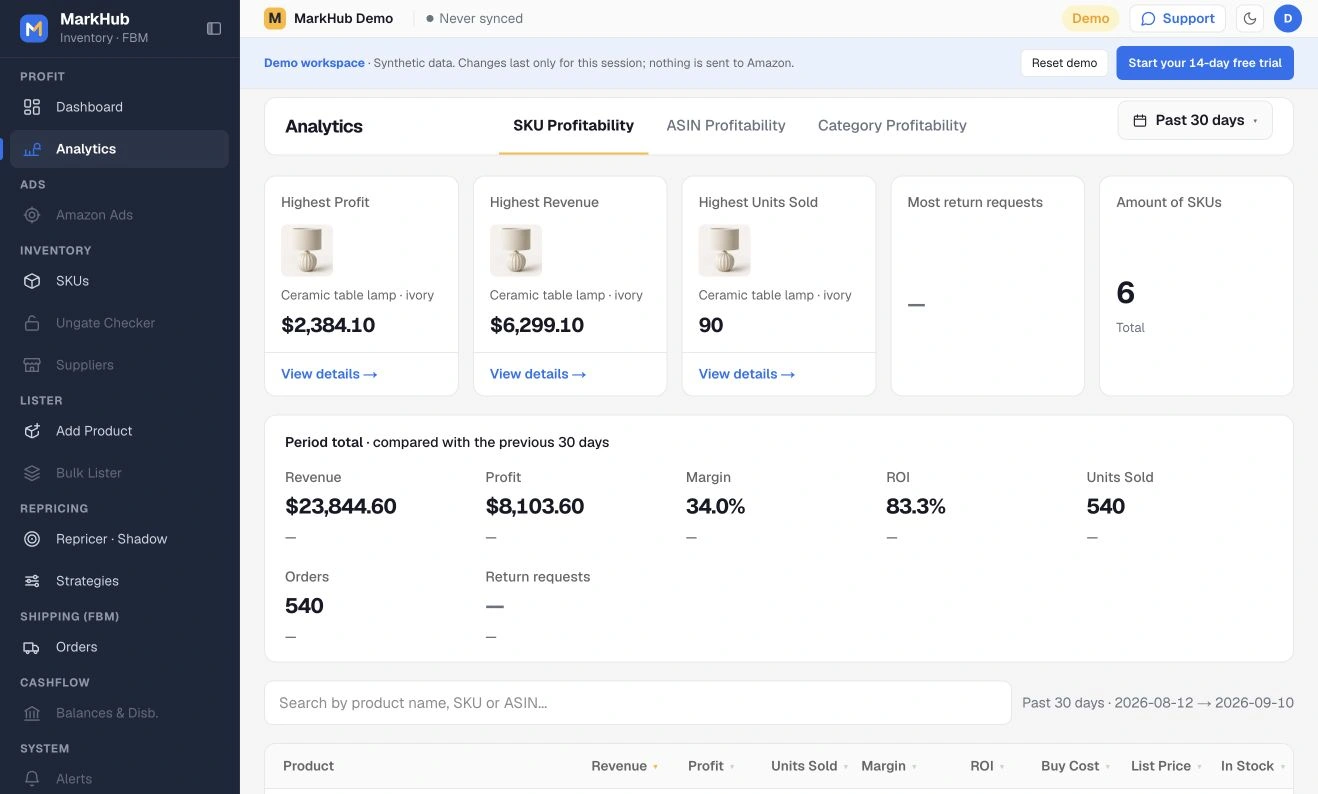
Analytics brings the product rankings and profitability table into one view. - 03
Find and compare your products
Search the table by product name, SKU or ASIN. Select a column heading to sort the results and compare products within the selected period.
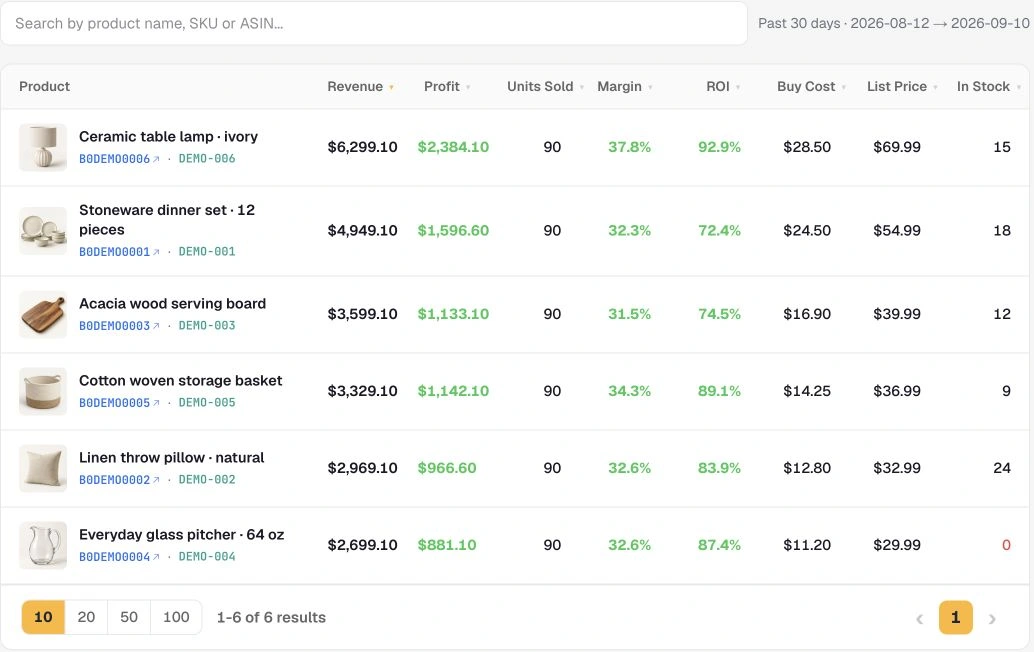
Detail: the search and profitability table put the product results side by side. - 04
Look inside a product’s results
Select a product name or View details to inspect its results. Compare Revenue, Profit, Margin, ROI and Buy Cost.
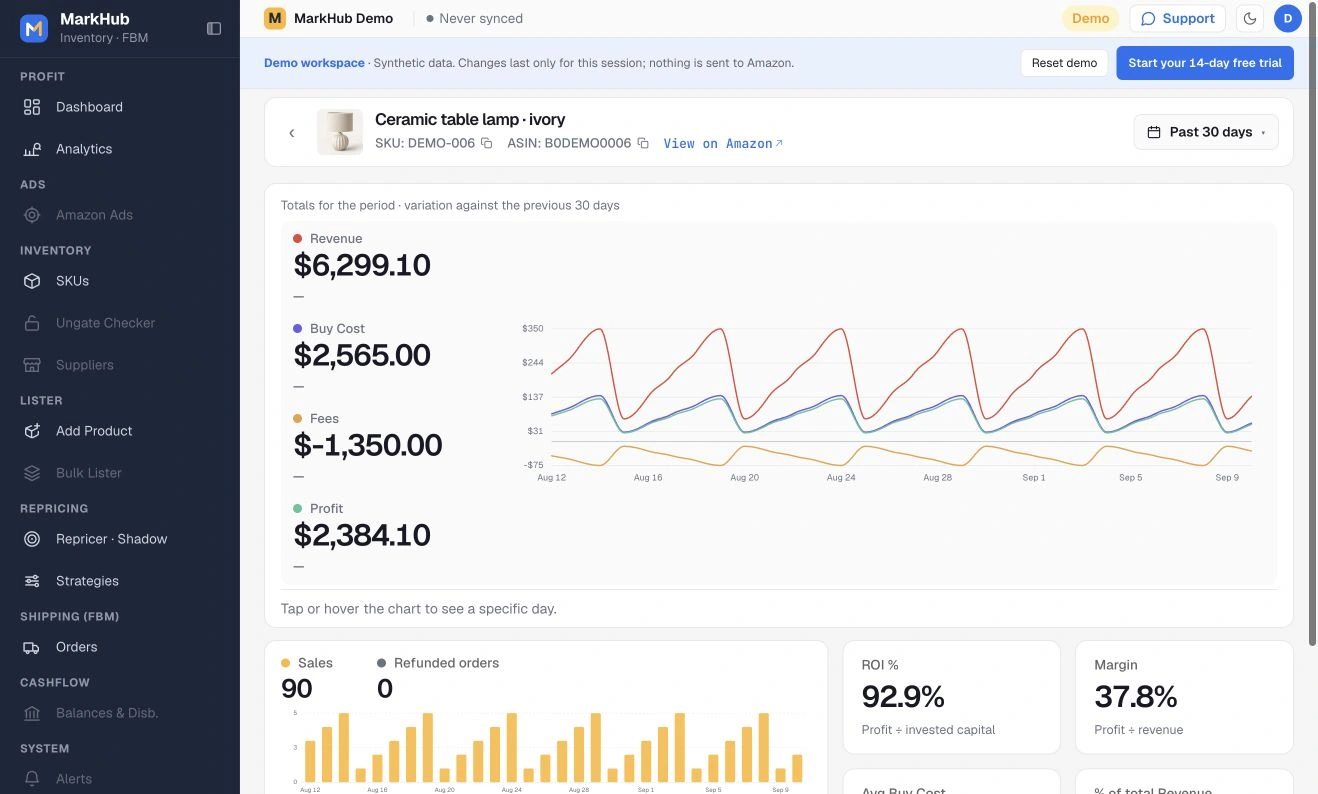
Product details make it easier to connect revenue, costs and profit. A dash does not mean zero profit. Missing costs or incomplete order cost records can prevent a calculation. Historical order costs are recorded at purchase time; editing a product does not rewrite those records.
Try it in MarkHub.
Explore these screens with sample products and orders. Demo changes stay separate from real stores.
Open the interactive demo